
Relay Coverage
Problem Statement
18 agents spread from a fixed base station to watch as much ground as possible. Coverage wants them spread; connectivity wants them clustered. The two pull against each other directly, and the trade-off is provably NP-hard on general graphs — so what follows is a gradient heuristic, not an optimum, and it is worth being clear about which one you have.
Model and Formulation
Coverage counts only cells within sensing range of an agent still reachable from the base:
Three forces:
| term | what it does |
|---|---|
| spread | mutual repulsion — this is what produces coverage |
| anchor | outward pull, so the fleet expands rather than settling into a ball |
| tether | connectivity gradient, scaled by hop count |
That last scaling is the interesting one. An agent three hops out is far more likely to be the one that severs the chain than an agent beside the base, so uniform connectivity effort wastes itself on agents that were never at risk.
Tuning and Failure Modes
- Do not count coverage you cannot report. Excluding unreachable agents is the single most important line in the metric; counting them is the easiest way to make a relay controller look far better than it is.
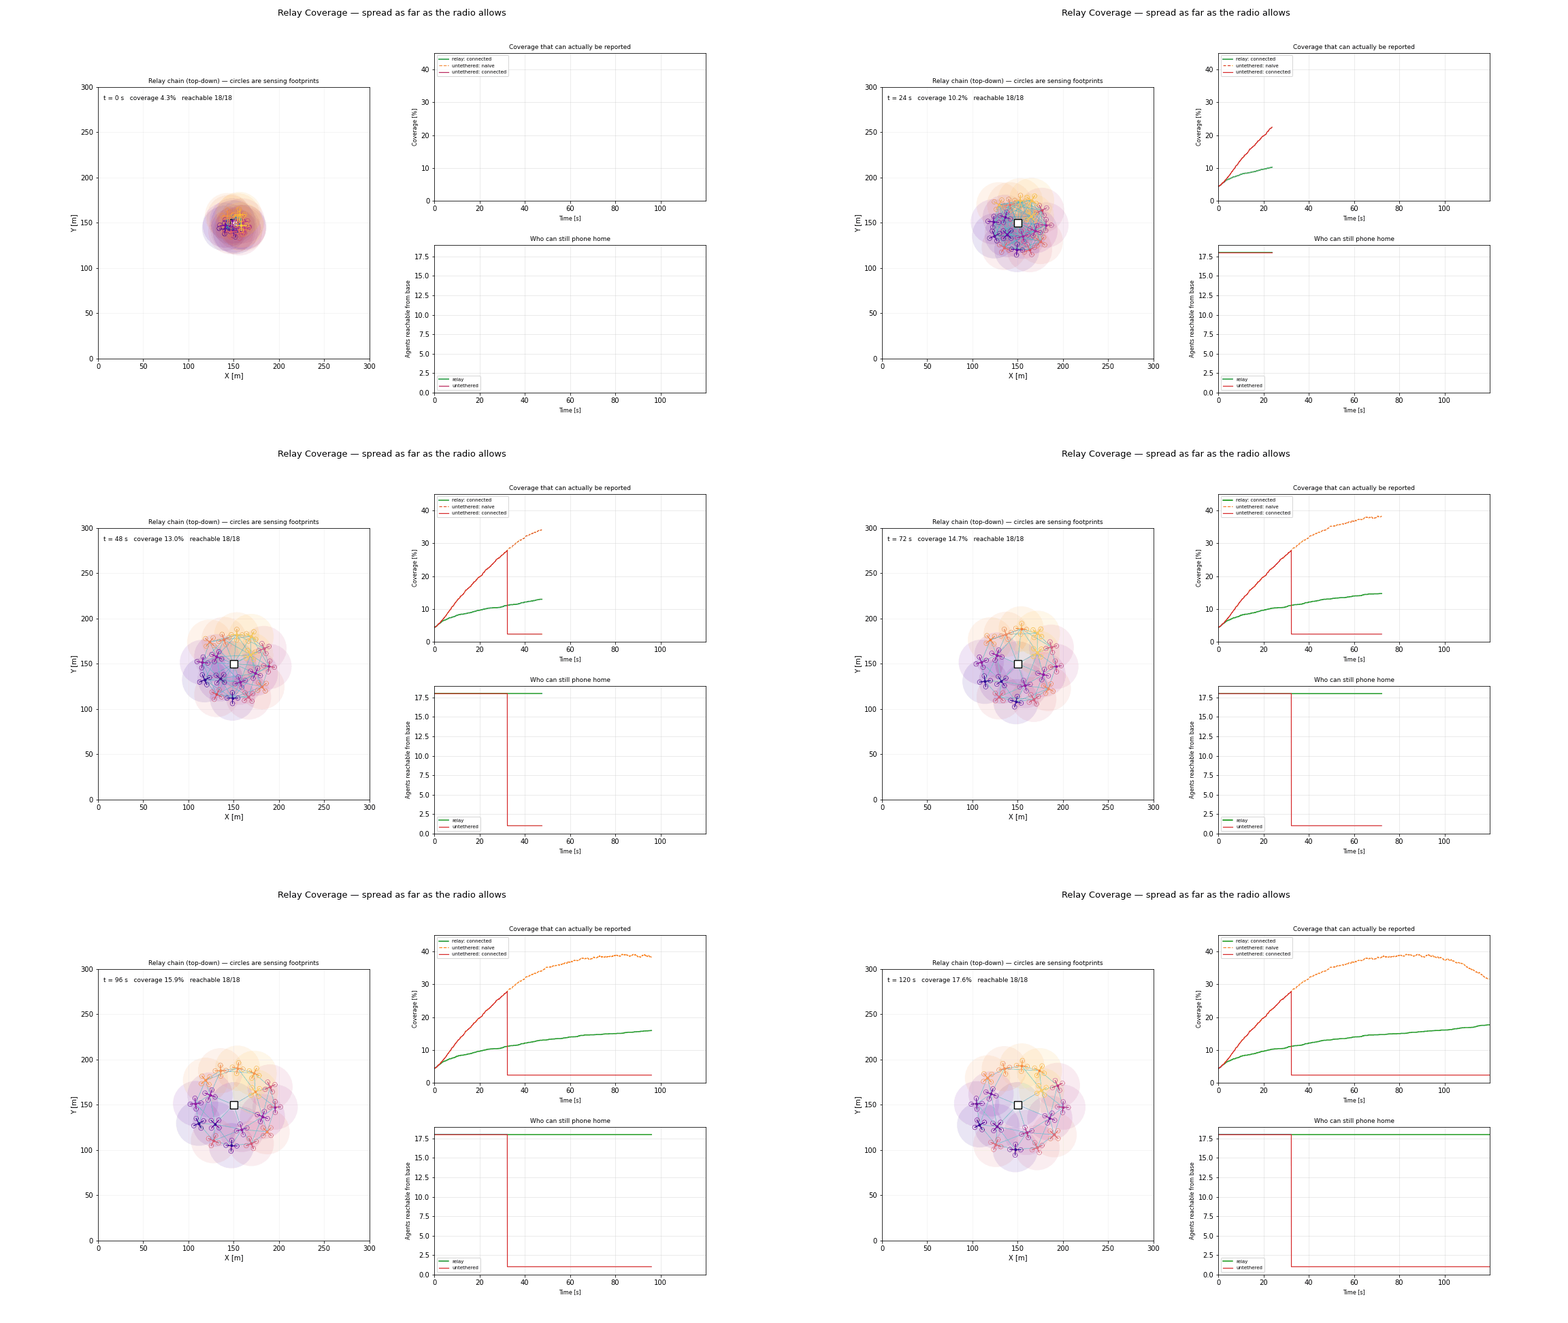
- Too little tether and the fleet spreads itself into uselessness. In the comparison run connected coverage falls off a cliff the instant the last link breaks — from 28 % to 2 % in one step.
- Too much tether and it never leaves the base. The gain sets where on the trade-off you sit; there is no setting that wins both.
- Hop count is a coarse proxy for exposure. It ignores link margin, so an agent one weak hop out is treated as safer than one two strong hops out. A margin-weighted path cost would be better and is not implemented here.
Implementation and Execution
python -m flybots.simulations.comms.relay_coverageEvidence
| run | connected coverage | naive coverage | reachable |
|---|---|---|---|
| relay | 17.6 % | 17.6 % | 18/18 |
| untethered | 2.3 % | 31.4 % | 1/18 |
The untethered run looks nearly twice as good if you count every agent's footprint regardless of whether it can report. That gap between the orange and red curves is the entire argument for connectivity-aware coverage.
References
- Scherer and Rinner, Long-term area coverage and radio relay positioning using swarms of UAVs (2018)
- CARA: Connectivity-Aware Relay Algorithm for Multi-Robot Expeditions (2022)
- Multi-UAV path planning for connectivity-based sweep coverage (2025)