Dashboard feature tour
The dashboard is a Next.js app in dashboard/.
It reads Postgres through a read-only role, or a committed static snapshot when no
database is configured. Every number on it comes from a SQL view, so the dashboard,
the HTTP API and the Dune queries agree by construction.
Watch it first
The 75-second demo video walks through everything on this page.
Overview page
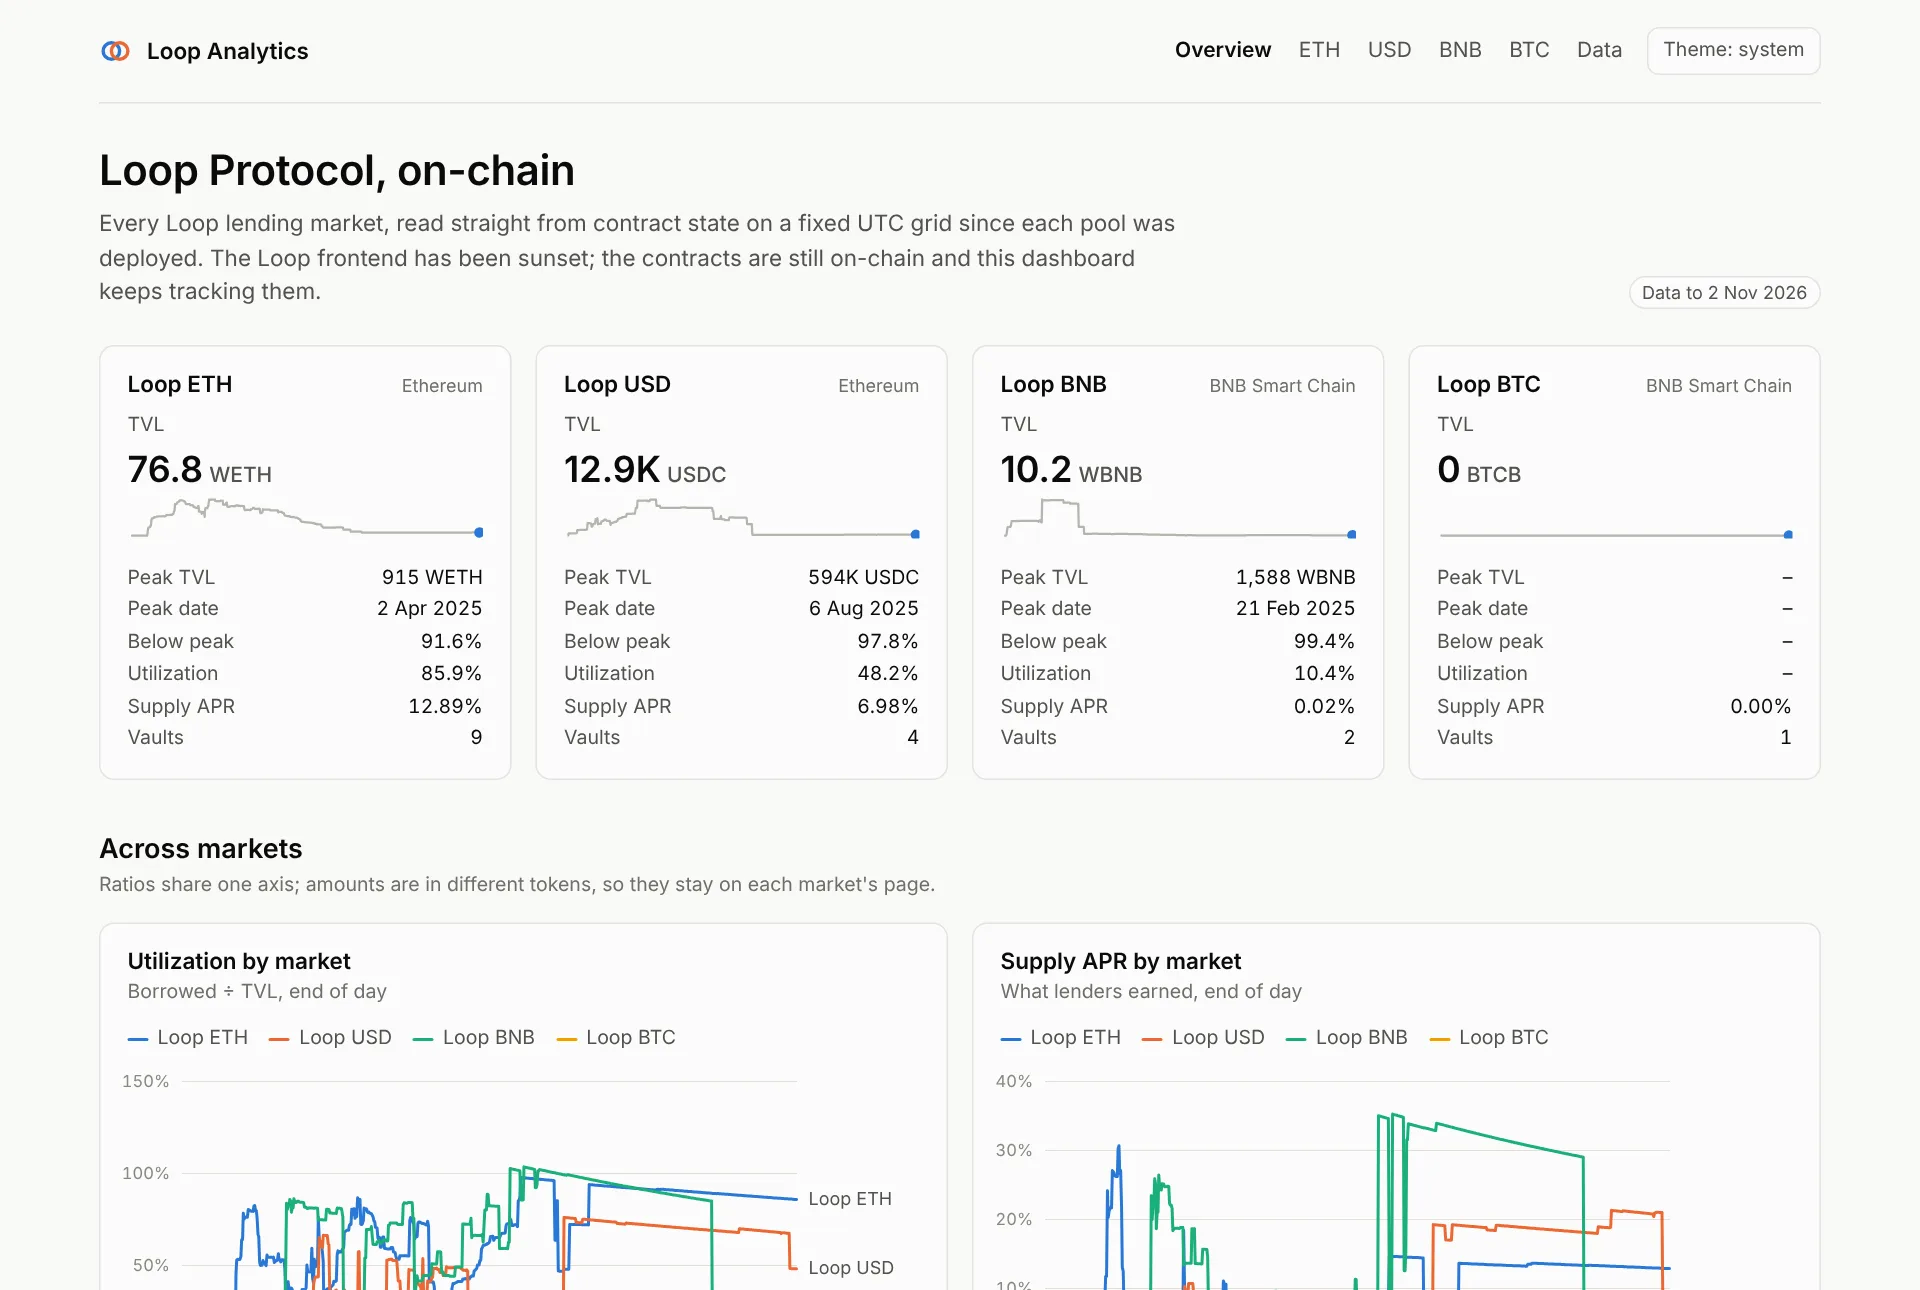
One card per market (lpETH, lpUSD, lpBNB, lpBTC) with the latest TVL, peak TVL and date, drawdown from peak, utilization, supply APR and vault count, plus a sparkline. Below, cross-market charts put utilization and supply APR for all four pools on one axis. Amounts stay on each market's page, because they are in different tokens.
Data findings lists every vault-day where debt exceeded the collateral value at the vault's own oracle (LTV above 100%): under-collateralised positions the protocol's UI never showed.
Market pages
Each market has five tabs and one date-range filter (30D, 90D, 1Y, All) that scopes every chart and number on every tab. The header links the pool and staking contracts on the block explorer, and the market's data as CSV and JSON.
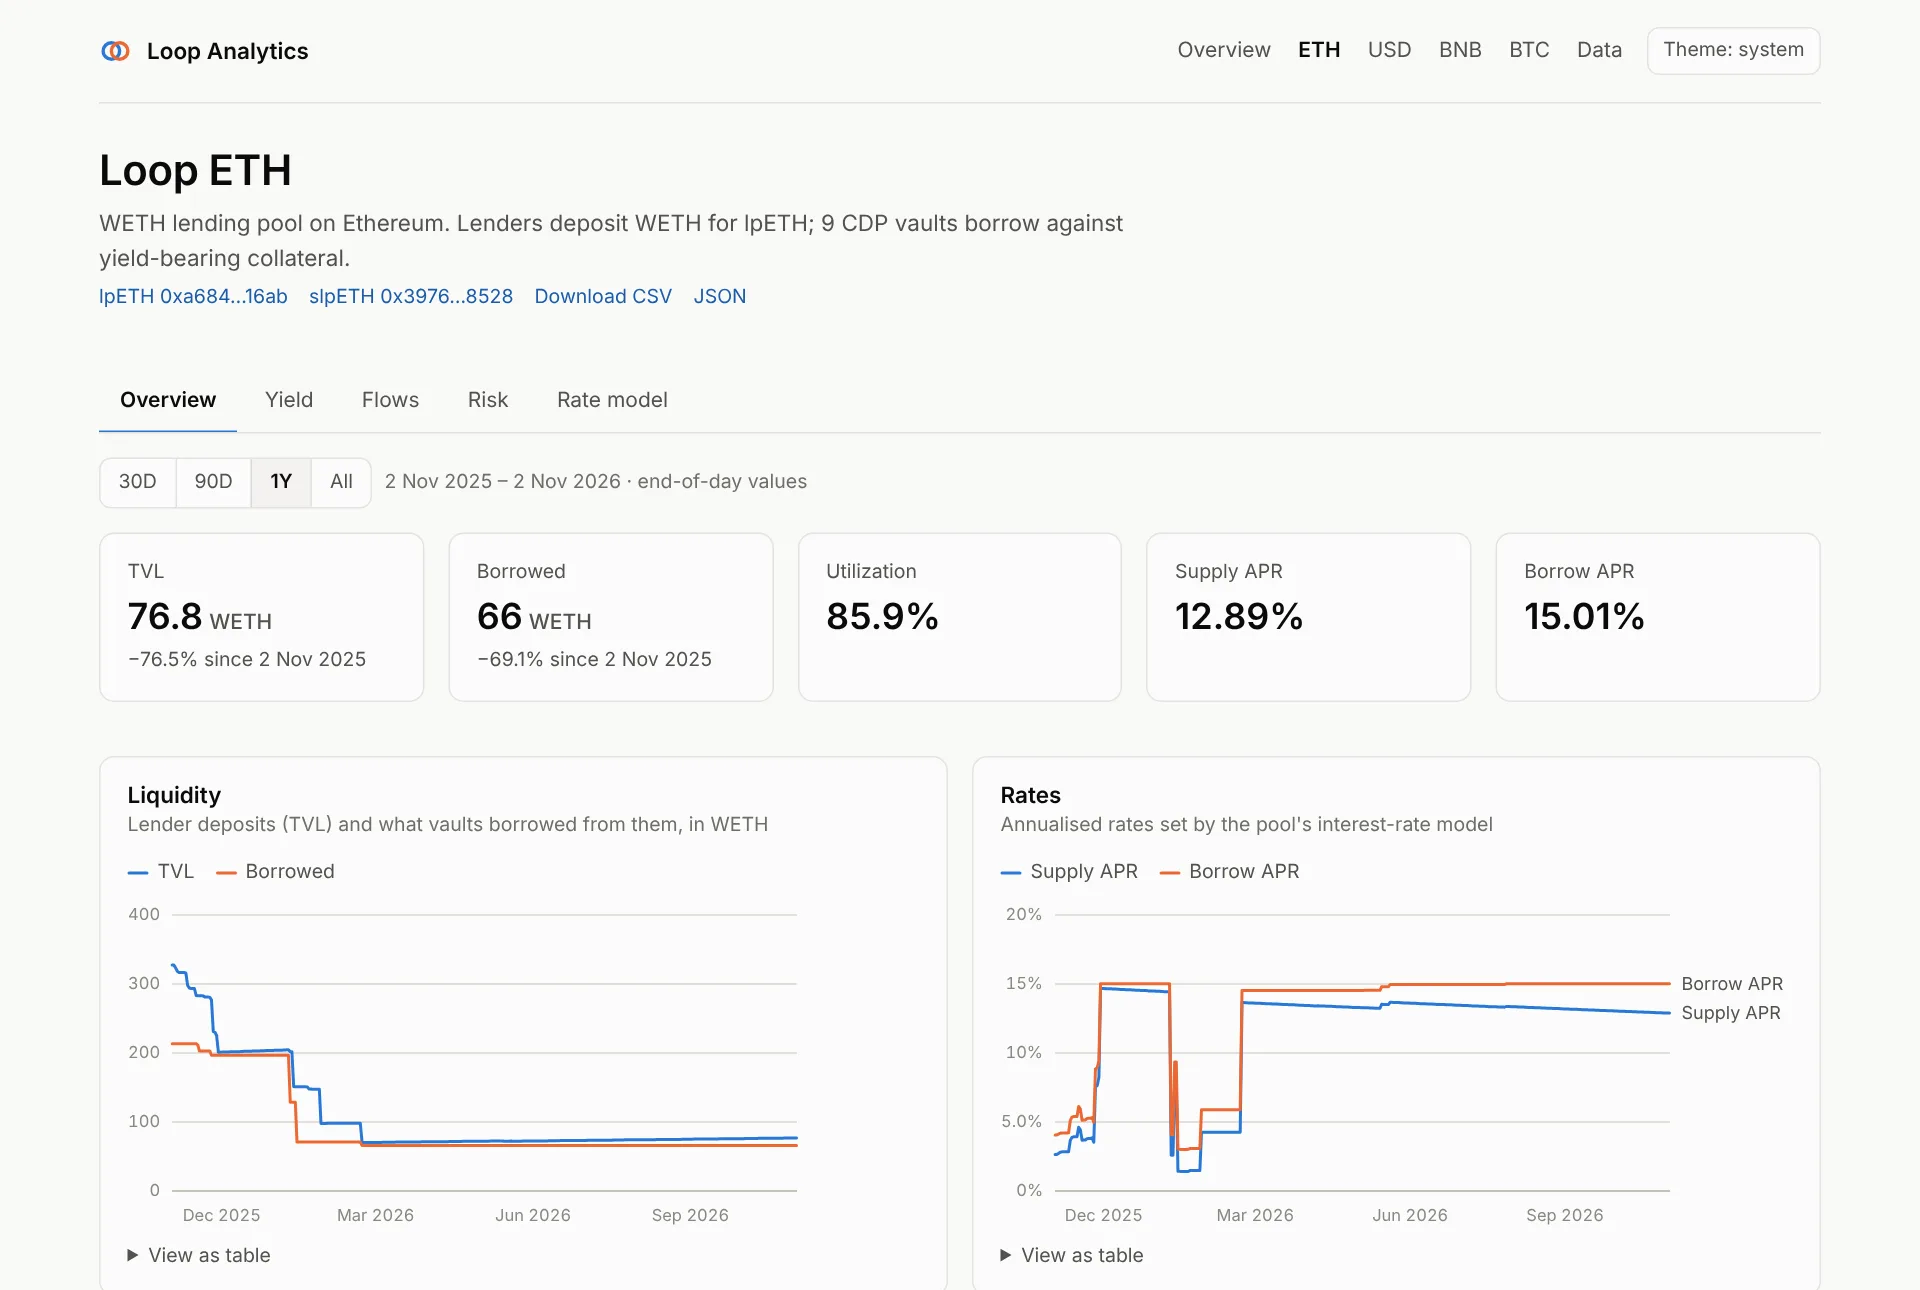
| Chart | What it shows |
|---|---|
| KPI tiles | TVL (with peak and date), borrowed, utilization, supply and borrow APR |
| Liquidity | Lender deposits (TVL) vs what vaults borrowed |
| Rates | Supply and borrow APR set by the interest-rate model |
| Utilization | Borrowed ÷ TVL, end of day |
| Collateral and debt | All vaults' collateral, valued at each vault's oracle, vs vault debt |
| Share price | The lp token's exchange rate: what one lp token redeems for |
| Staked and locked | lp tokens staked in the staking vault, and locked |
| Vault table | Every CDP vault: collateral, debt, LTV, liquidation ratio, capacity used |
Source: loop.market_daily, and loop.vault_daily for the vault table.
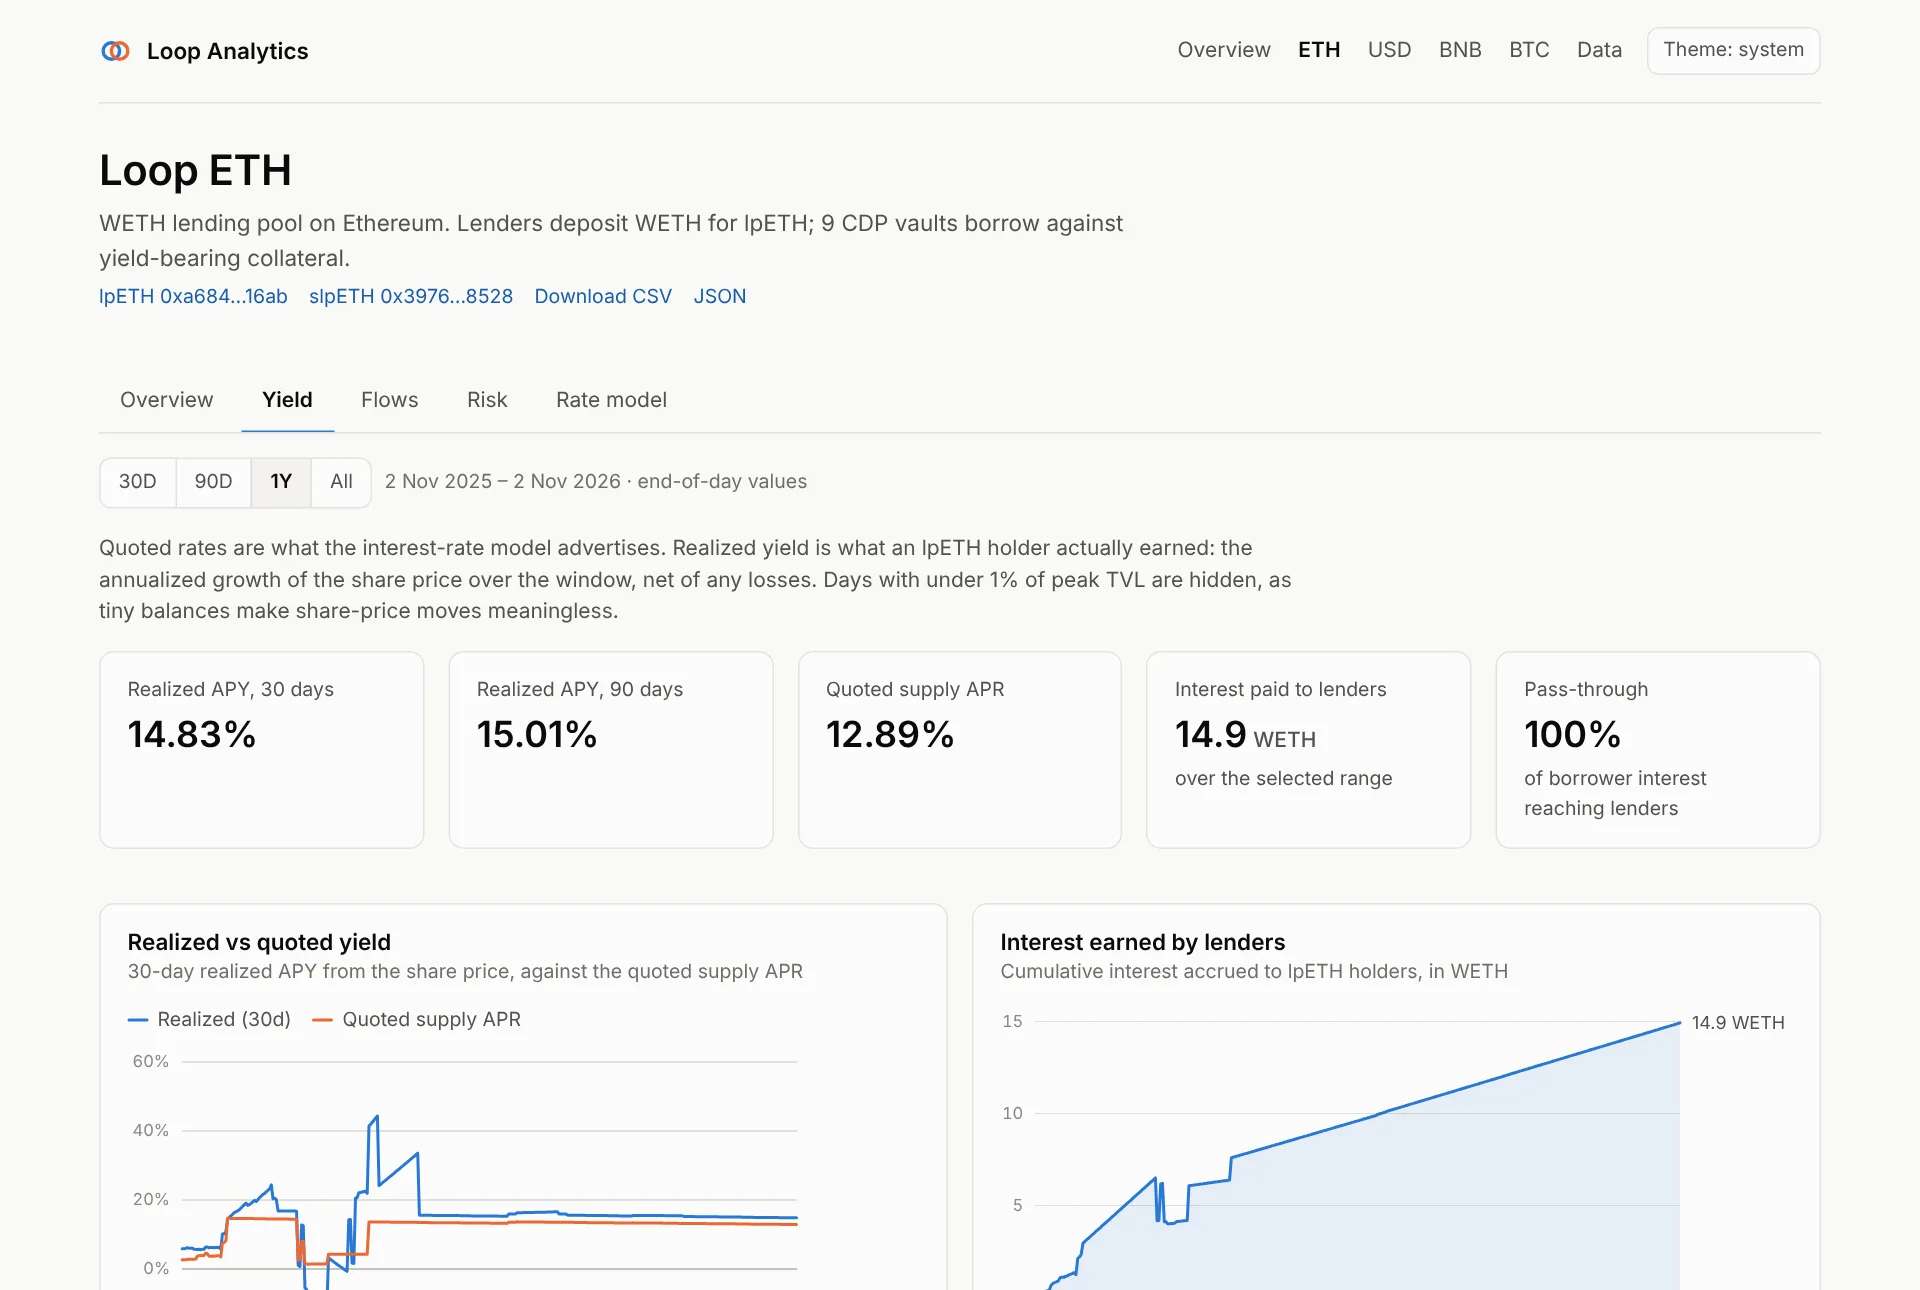
What lenders actually earned, not what the rate model advertised.
- Realized APY (30 and 90 days) is the annualised growth of the lp share price over the window, net of any losses.
- Realized vs quoted yield charts the 30-day realized APY against the quoted supply APR. Gaps mean write-downs or idle liquidity.
- Interest earned by lenders accumulates over the selected range.
- Pass-through is the share of borrower interest that reached lenders.
Days with under 1% of peak TVL are hidden: on tiny balances, share-price noise
dominates. Source: loop.market_yield_daily.
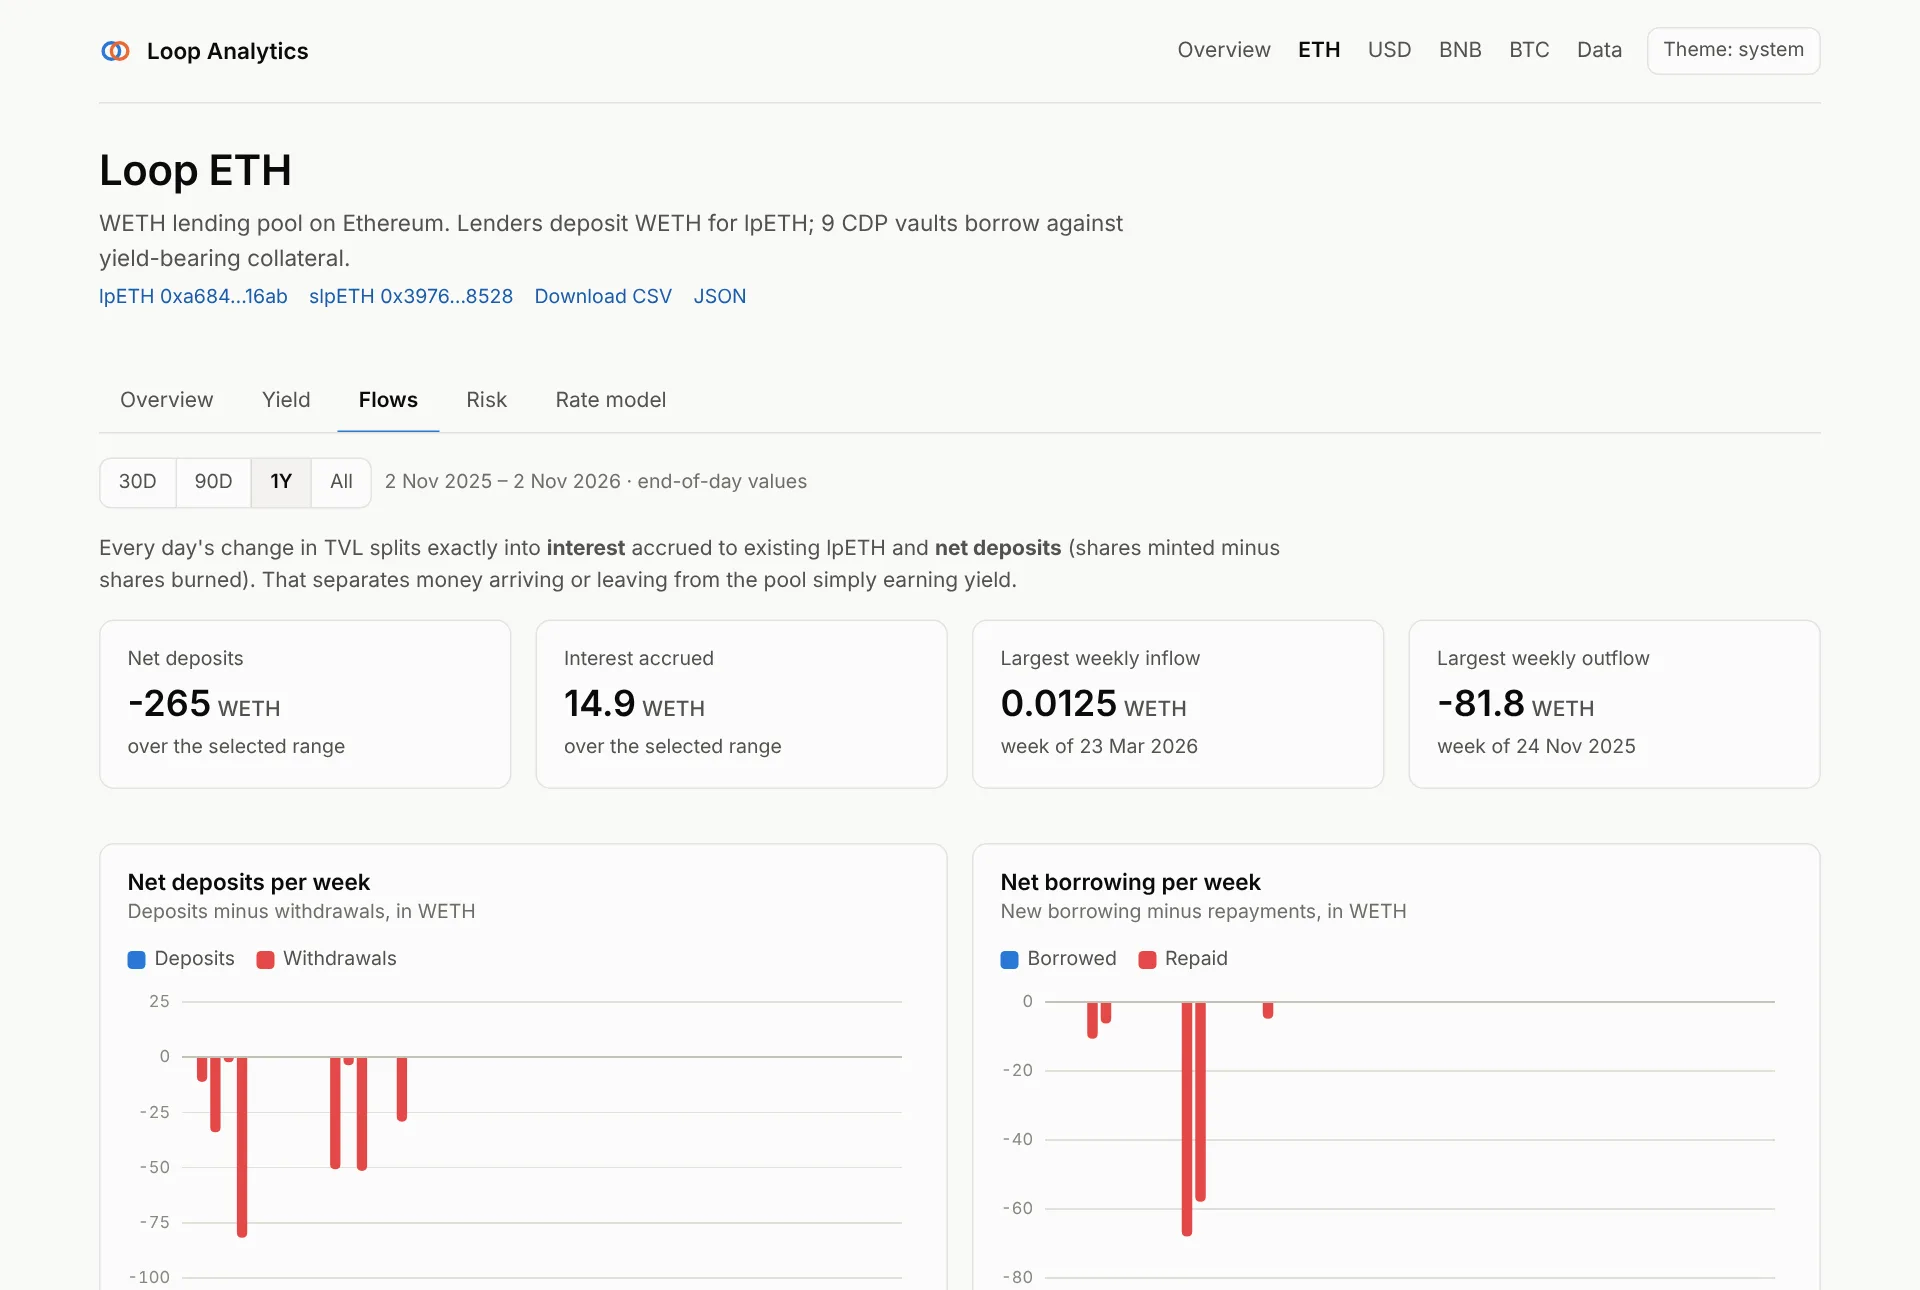
Where TVL changes came from. Each day's TVL change splits exactly into interest accrued (the share price moving) and net deposits (shares minted minus burned):
- KPI tiles: net deposits and interest over the range, largest weekly inflow and outflow.
- Net deposits per week and net borrowing per week as diverging bars.
- What moved TVL: cumulative deposits vs interest since the start of the range.
Source: loop.market_flows_daily.
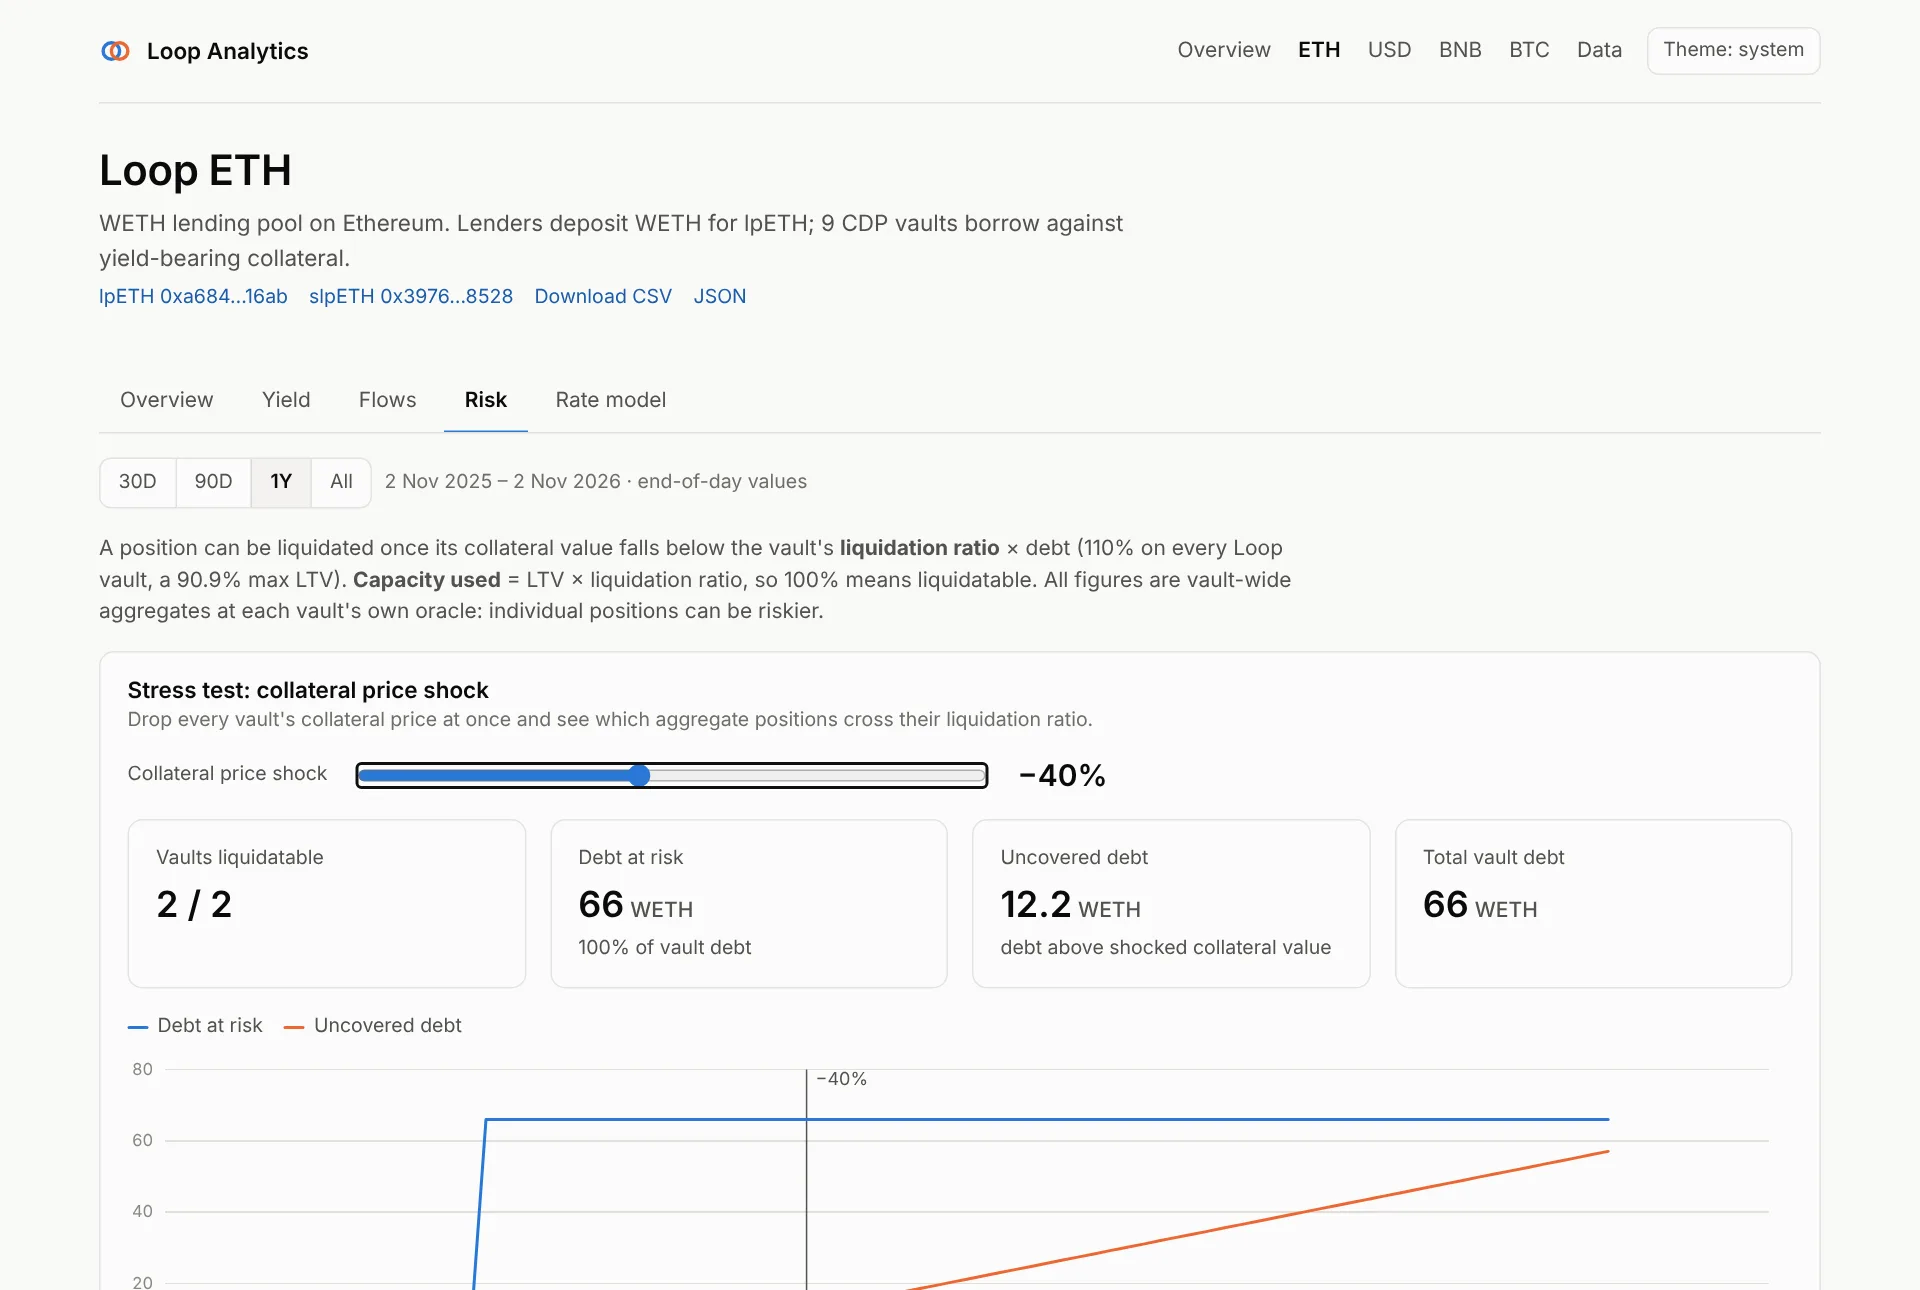
- Stress test. Drag the slider to drop every collateral price at once. The tiles show how many vaults cross their liquidation ratio, the debt at risk, and the uncovered debt (debt above the shocked collateral value). The chart shows the whole curve from 0 to −100%.
- Liquidation proximity by vault: a heatmap of capacity used per vault and day (LTV × liquidation ratio, so 100% means liquidatable).
- Debt by vault and debt concentration (Herfindahl index and top-vault share).
- Oracle events: day-over-day collateral price moves above 20%.
All figures are vault-wide aggregates at each vault's own oracle; individual
positions can be riskier. Sources: loop.vault_daily, loop.vault_share_daily,
loop.market_concentration_daily, loop.oracle_daily.
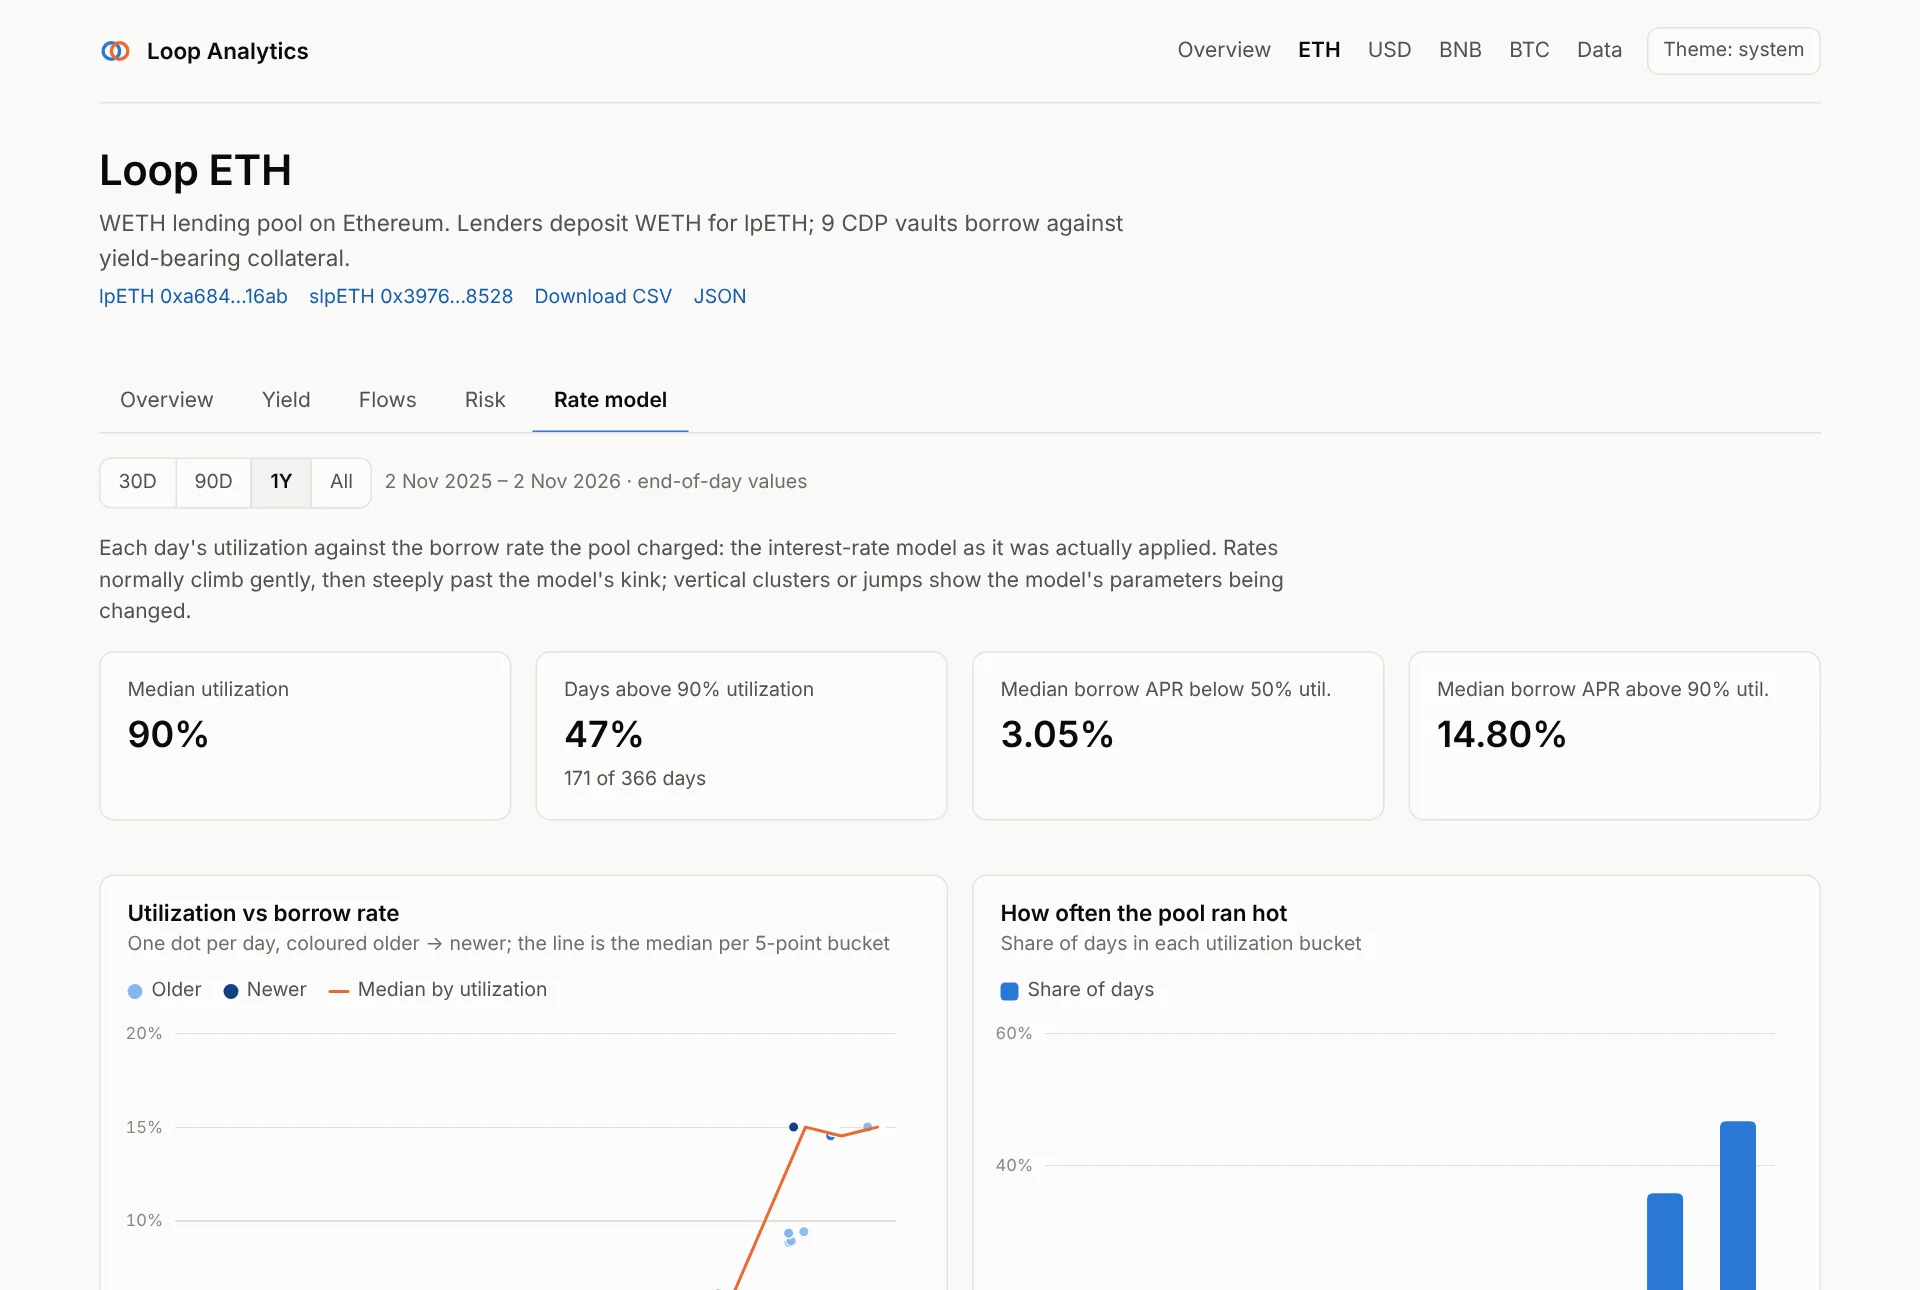
The interest-rate model as it was actually applied:
- Utilization vs borrow rate: one dot per day, coloured older → newer, with the median curve per 5-point utilization bucket. Rates usually climb gently, then steeply past the model's kink. Two separate clusters mean the parameters changed: lpETH's model was retuned in June 2025.
- How often the pool ran hot: the share of days in each utilization bucket.
- KPI tiles: median utilization, days above 90%, and median borrow APR below 50% and above 90% utilization.
Data page
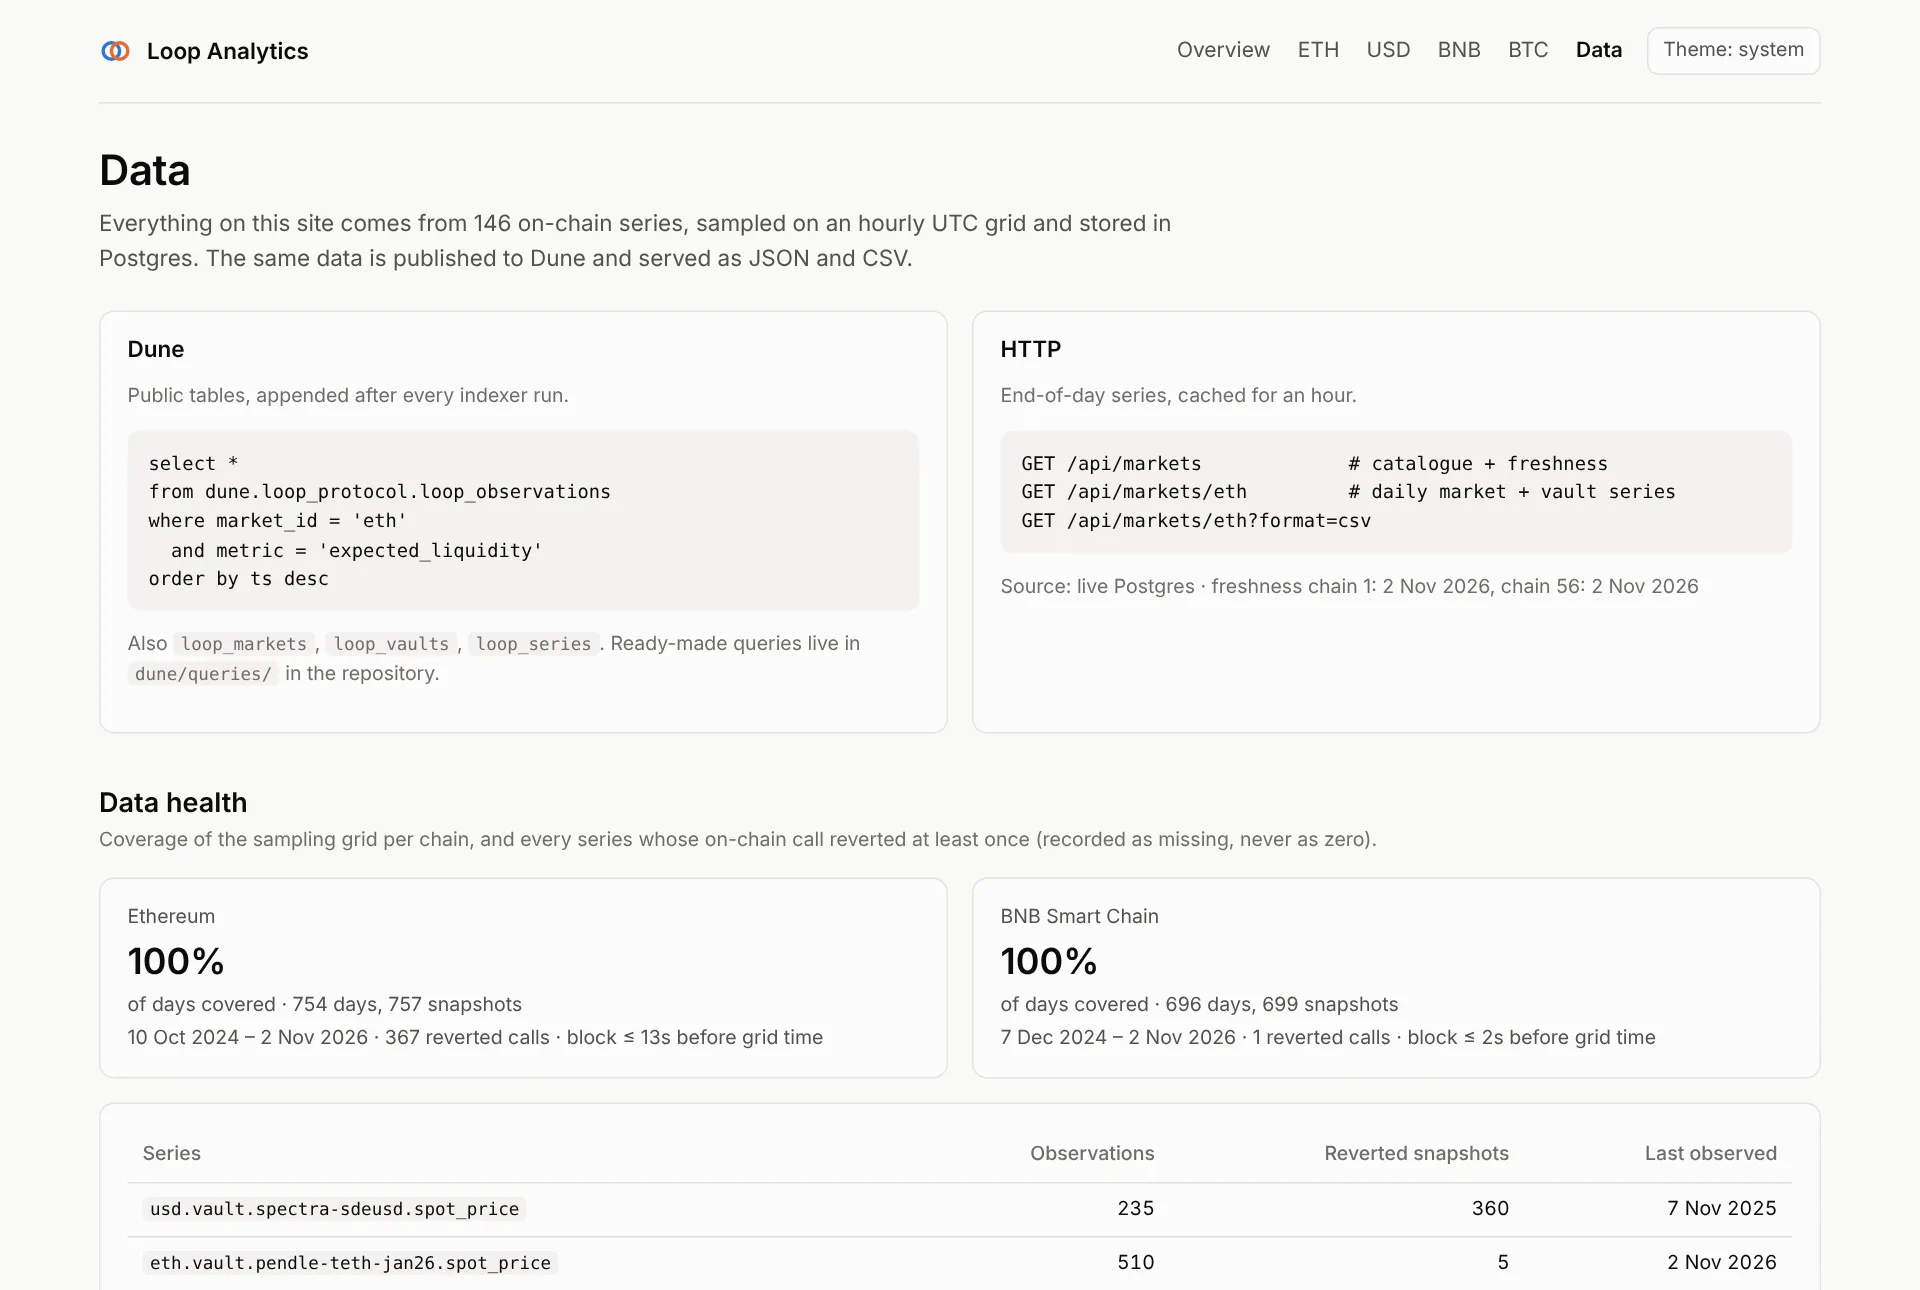
The reference for everything behind the charts:
- how to query the same data on Dune and over HTTP,
- data health: share of the sampling grid covered per chain, and every series whose on-chain call reverted at least once (recorded as missing, never as zero),
- every Postgres view, one line each.
Accessibility and usability
- Every chart has a View as table toggle with the exact values.
- Charts are keyboard-navigable: focus a chart and use the arrow keys to move between days, bars or cells; tabs follow the WAI-ARIA pattern (arrows, Home, End).
- Light and dark themes, following the system setting by default, with a chart palette validated for contrast in both.
- The selected tab is kept in the URL hash (
/markets/eth#risk), so links open the same view.
Data sources and freshness
| Mode | When | Freshness |
|---|---|---|
| Postgres | DATABASE_URL is set |
Pages are cached for an hour and rebuilt as soon as the indexer lands new data (on-demand revalidation) |
| Static snapshot | no DATABASE_URL (forks, previews) |
The JSON in dashboard/data/, refreshed with make export-static |