



Watch the 75-second tour — install, live monitoring, the line-based commands, and record/replay.
Why it exists
Debugging a behaviour tree usually means running Groot2 on a laptop, on the same network, with a display attached. Robots are rarely that convenient. You are on a serial console in a lab, or SSH'd in over a link that drops, or reading back a run that ended hours ago.
btview puts the tree where you already are: a terminal. It speaks the ZMQ protocols
BehaviorTree.CPP already publishes, so
there is nothing to install on the robot and no ROS client library in the dependency tree.
-
A monitor, not a toy
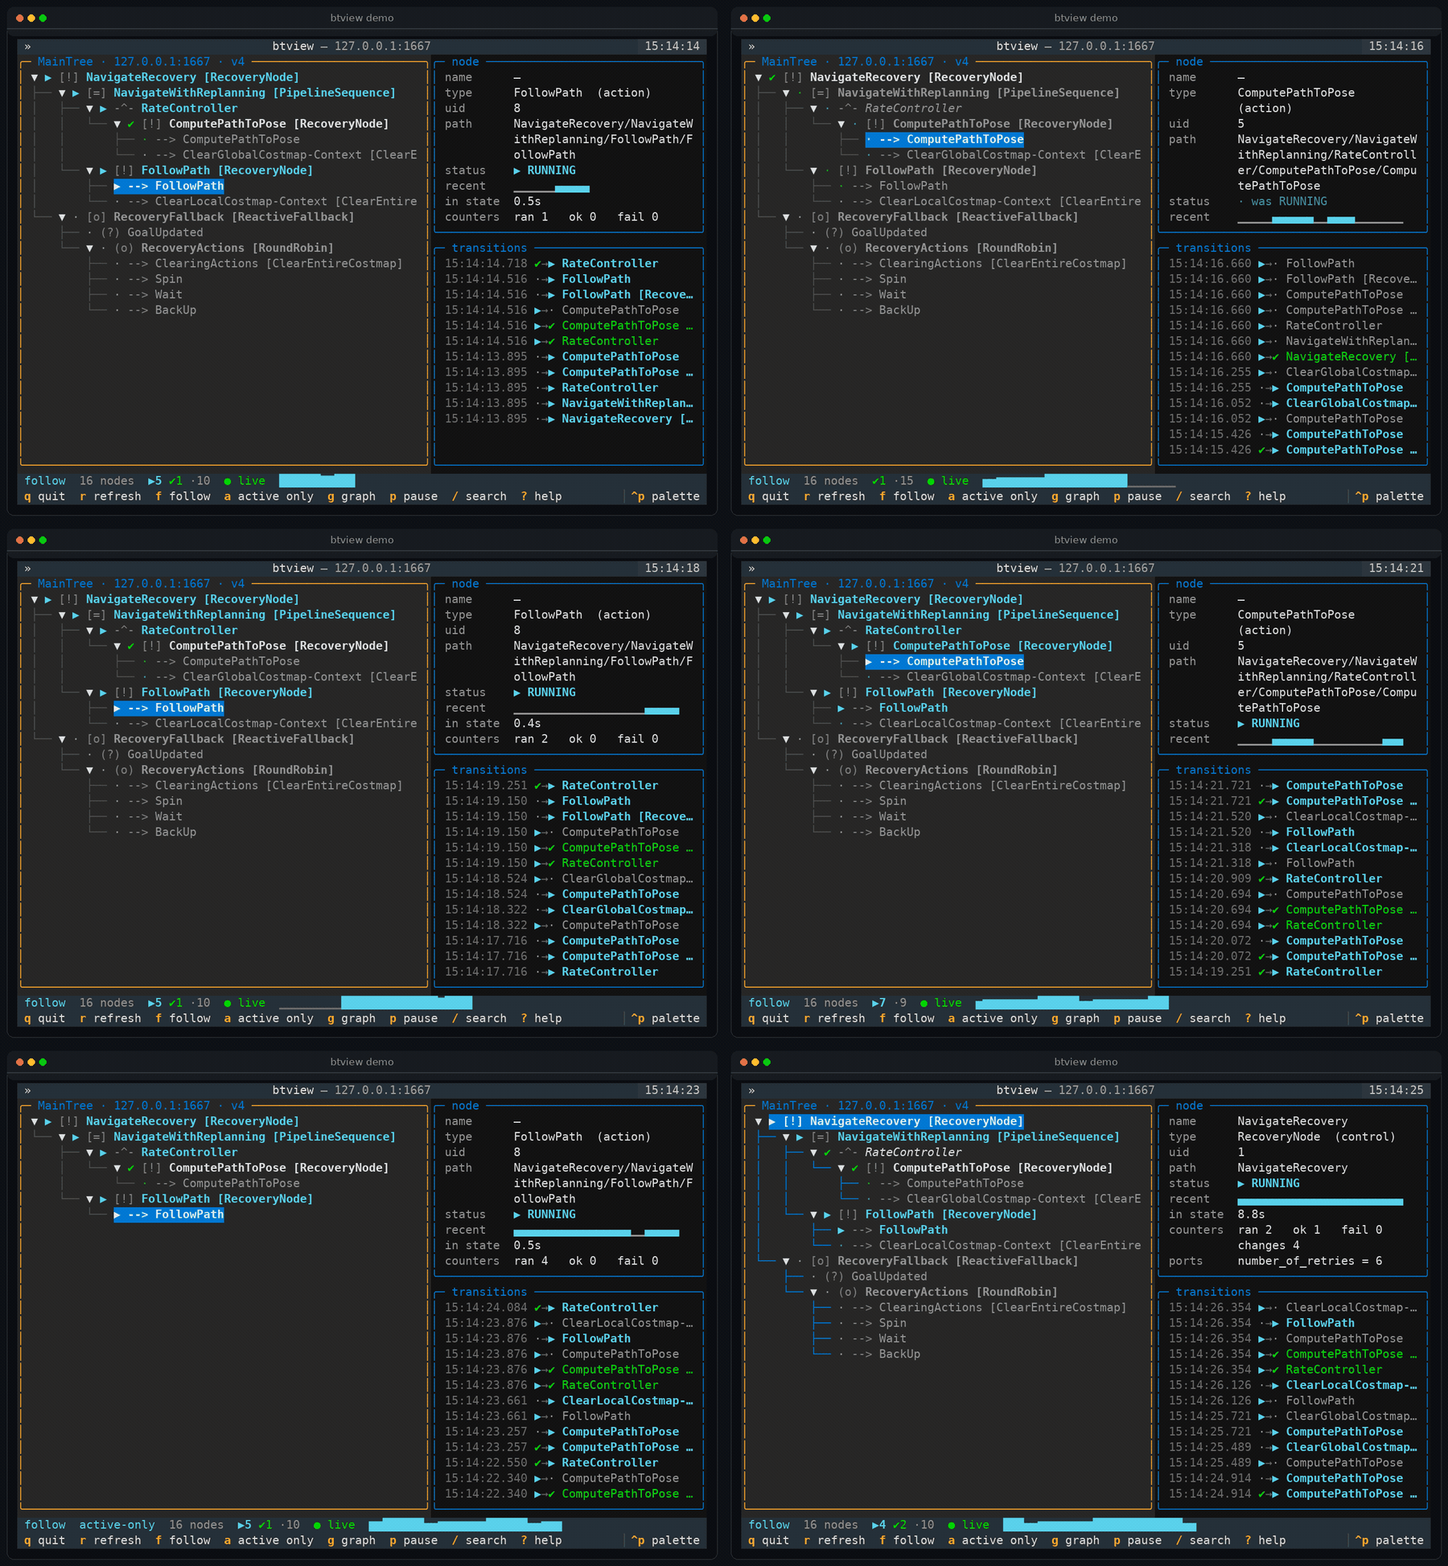
Live tree, node inspector, transition log, per-node sparklines. Mouse-aware, and it redraws happily at 4 Hz over a bad link.
-
Two ways to read a tree
An indented list for hunting one node, and a drawn graph for seeing which branch the robot went down.
-
More than a UI
snapshotfor scripts,echofor logs and CI,exportfor issues,record/playfor the failure you only see at 3 a.m. -
Pluggable transports
A live robot, a recording and a bridged v3 publisher are interchangeable everywhere. Groot2 can even watch a BehaviorTree.CPP 3.x robot through it.
Try it without a robot
btview demo runs a synthetic Nav2 tree — plan, follow, costmap-clearing recoveries, a
round-robin of spin/wait/back-up — through the real protocol stack over a real socket.
Nothing about the UI path is faked, so a working demo is also a working install check.
Point it at a real robot
bt_navigator:
  ros__parameters:
    navigate_to_pose:
      plugin: "nav2_bt_navigator::NavigateToPoseNavigator"
      enable_groot_monitoring: true
      groot_server_port: 1667
btview --host 192.168.1.42            # full-screen monitor
btview snapshot --host 192.168.1.42   # one shot, then exit
Monitoring is off by default
A disabled publisher looks exactly like a firewall problem — nothing listening, and no
log line saying why. On current Nav2 the switch lives inside the navigator block, not
at the top level of ros__parameters, where it is silently ignored.
Reading the tree
[!] NavigateRecovery [RecoveryNode]                          ▶ RUNNING
├─ [=] NavigateWithReplanning [PipelineSequence]             ▶ RUNNING
│  ├─ -^- RateController                                     ▶ RUNNING
│  │  └─ [!] ComputePathToPose [RecoveryNode]                ✔ SUCCESS
│  │     ├─ --> ComputePathToPose                       · was SUCCESS
│  │     └─ --> ClearGlobalCostmap-Context                      · IDLE
│  └─ [!] FollowPath [RecoveryNode]                          ▶ RUNNING
└─ [o] RecoveryFallback [ReactiveFallback]                      · IDLE
Node-type glyphs follow py_trees convention, so a tree reads the same in both ecosystems.
| Glyph | Node kind | Glyph | Status | |
|---|---|---|---|---|
[-] |
sequence | ▶ |
running | |
[o] |
fallback | ✔ |
success | |
[=] |
pipeline sequence | ✖ |
failure | |
[!] |
recovery | ⊘ |
skipped | |
-^- |
decorator | · |
idle | |
--> |
action | · was X |
idle, ran earlier | |
(?) |
condition |
--ascii swaps every one of these for a plain-text equivalent, and NO_COLOR is honoured.
A 9600-baud serial console gets the same information as a 4K terminal.
Where to go next
- Install — pipx, pip, ROS 2 workspaces, offline robots
- Docker — run it without installing anything
- Nav2 — turn monitoring on, reach the port, read the load
- Wire protocols — the byte layouts, if you are porting
- Development — tests, the Python API, releasing